

Effective Use of Likert Scales in Visualization Evaluations: A Systematic Review
An opinionated summary

Hi 👋!
I'm João and I'm working as a Data Visualization Engineer at Feedzai. As part of the Research Department, we develop new charts and tools to support data scientists and fraud analysts. Each day is a mix of User Experience, Data Visualization, and Python/Front-End Programming.
Also, I enjoy working on (personal) open-source projects, exploring/visualizing different datasets, and eating (I really like food).
A Likert scale is a method for collecting quantitative estimates of subjective attributes. It works as an alternative to qualitative methods and is applied via questionnaires. This (survey) paper reviews 134 visualization papers and reports the usage of Likert scales in evaluations. One of the main conclusions is that many papers do not describe Likert scales in sufficient detail for replication. The authors also summarize some guidelines for creating and reporting Likert scales.
- Authors: Laura South, David Saffo, Olga Vitek, Cody Dunne, Michelle A. Borkin
- Year: 2022
- Paper
Takeaways
- Likert scale results can be interpreted as ordinal (i.e., discrete) or interval (i.e., continuous).
- Ordinal (Likert) data are usually summarized using the median and analyzed using nonparametric statistical procedures. Interval data are usually summarized using the mean and analyzed using parametric statistical methods. Depending on this assumption, different charts are also used (e.g., stacked bar charts as discrete visualizations and violin plots as continuous visualizations).
- 123 of the papers (92%) created custom Likert questionnaires instead of using standard questionnaires (e.g., SUS and NASA-TLX).
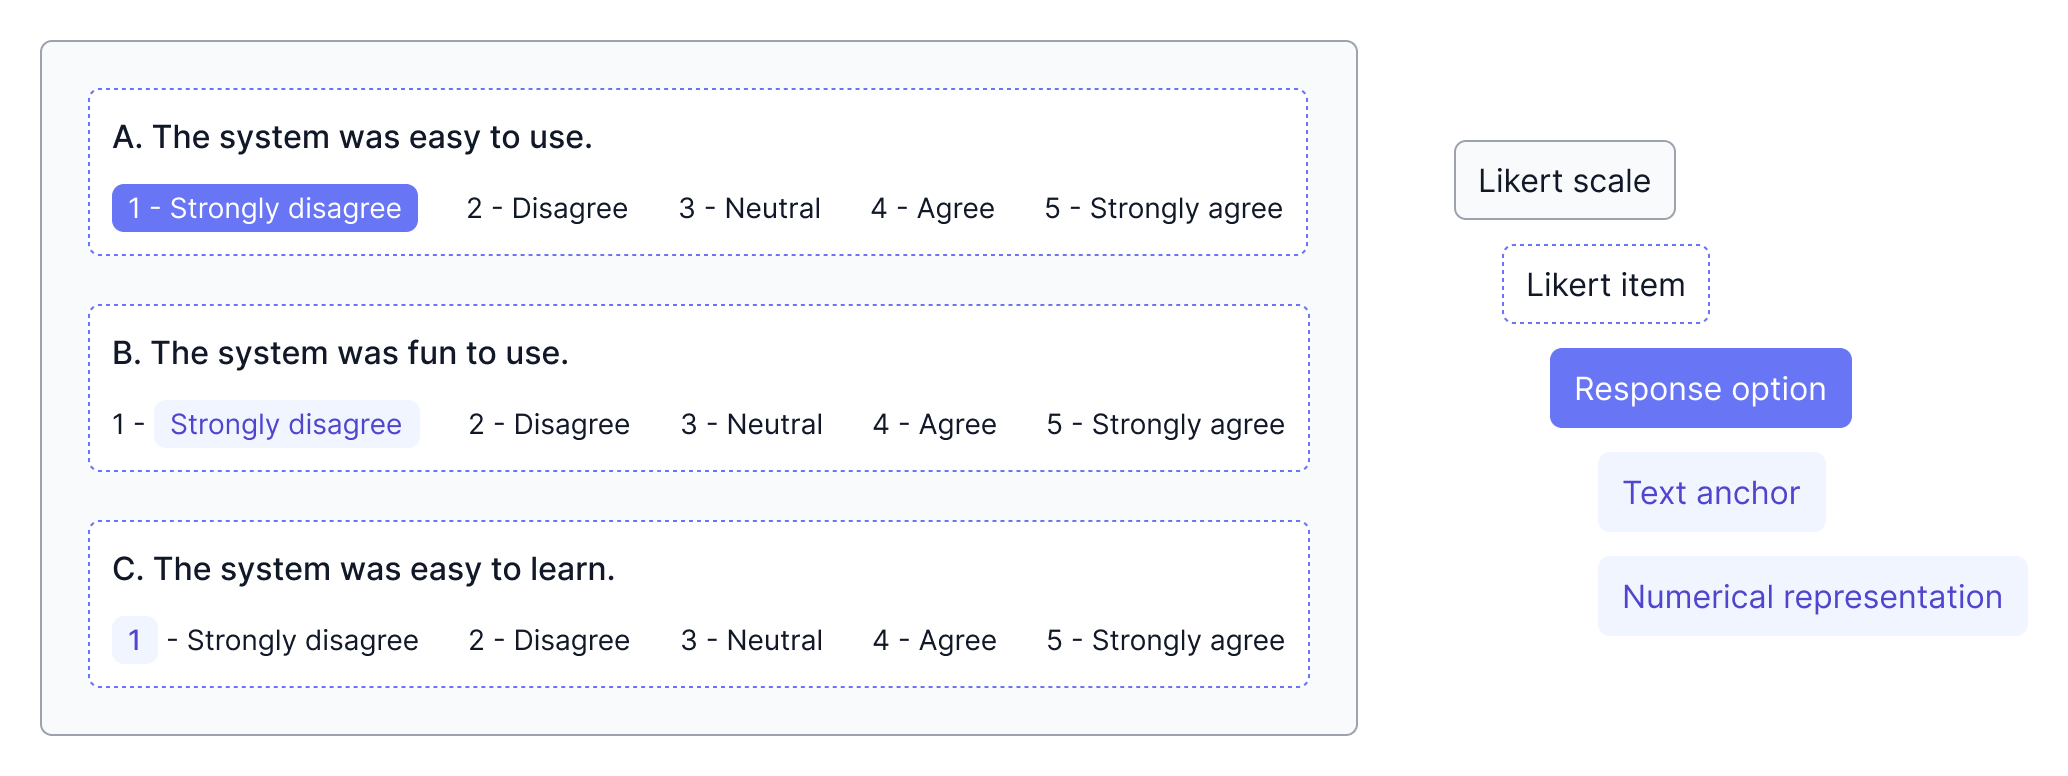
- Most Likert items have 5 or 7 options (116, 87%). Even-numbered items without a "Neutral" option are appropriate in some cases (e.g., when participants are familiar with the subject matter).
- Providing text anchors for all options yields more reliable answers than labeling just the endpoints. On the other hand, if we want to relate variables/Likert items and estimate linear relations using correlations or regression models, for example, Likert scales with endpoint labels are the best option.
- Most Likert items use ascending (starting at 1) scales (88, 64%). However, there are other alternatives, such as symbolic and divergent scales.
- The number of response options is the most commonly reported part (130, 97%). Only 14 papers (10%) report all text anchors. More than half of the papers (76, 55%) only report item topics, not full question phrasings.
- Approximately half of the papers do not use any visualization for Likert scales (65, 49%). 35 papers use discrete visualizations (26%), and 34 papers use continuous ones (25%).
- Papers using ordinal summary statistics are consistent (in terms of visualizations and statistical analysis). Several papers that started with interval summary statistics are inconsistent and use ordinal approaches in their studies.
- To see if a Likert scale is a good fit for a study, check if the research question is specific enough to reduce it to quantitative estimates without losing valuable nuance and context.
- Provide detailed descriptions of the Likert scale design used — no shortcuts.
- When visualizing Likert data, match (chart) axes to (Likert) scales (add text anchors and numerical representations to charts).
- Analyze and report on all Likert items, not just a few.
- Use best practices for objective data (e.g., accuracy and speed) to handle quantitative subjective data (Likert data). Papers with both types of quantitative data often apply different standards. Power analyses and publicly available datasets are rare for objective and subjective studies.

